10,000 summer solstice sunrises.
[1-BIBLIS-B: https://pris.iaea.org/PRIS/CountryStatistics/ReactorDetails.aspx?current=91]
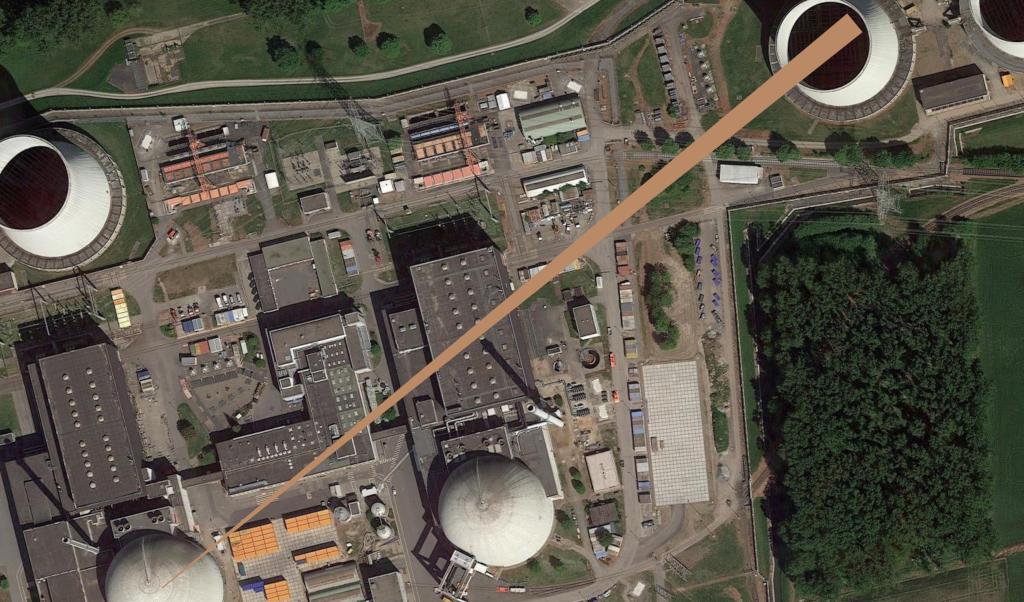
10,000 summer solstice sunrises charts the alignment of the rising sun on the summer solstice every 100 years over the course of 10,000 years at key human infrastructural locations, such as power stations, nuclear waste dumps and server farms.
10,000 summer solstice sunrises is inspired by the celebrated summer solstice alignment of Stonehenge and the allied practice of archaeoastronomy. The site is aligned in the direction of the sunrise of the summer solstice and the sunset of the winter solstice
The first of the series plots these celestial axes across the 34 sites of nuclear power reactors in Germany.
Each print in this series is now available in a signed edition of 10, archival giclee print on Hahnemuhle Photorag Baryta 315gr. Feel free to DM moi for price, shipping and to assess the full selection of prints in this series.
Software
'''

10,000 summer solstice sunrises charts the alignment of the rising sun
on the summer solstice every 10 years over the course of 10,000 years
at key human infrastructural locations, such as power stations,
nuclear waste dumps and server farms.

We need a CSV named places.csv with lines with name, longitude and latitude.

VAKKahl am Main, 50.0591294, 8.9871812, BWR, 15, 1960–1985,

To open all the CSVs as layers we use this python script in qgis python interpreter box:

import os.path, glob
layers=[]
for file in glob.glob('/root/notes_and_projectsNOW/contiguity_res/software/results/*'): # Change this base path
  uri = "file:///" + file + "?type=csv&delimiter=%7C&useHeader=No&wktField=field_2&spatialIndex=no&subsetIndex=no&watchFile=no&crs=epsg:4326"
  vlayer = QgsVectorLayer(uri, os.path.basename(file), "delimitedtext")
  vlayer.addAttributeAlias(0,'X')
  vlayer.addAttributeAlias(1,'Y')
  layers.append(vlayer)

QgsMapLayerRegistry.instance().addMapLayers(layers)


'''

from datetime import datetime, timedelta
from math import pi, degrees, radians
from operator import mod
import ephem
import csv, sys

def read_csv_file(filename):
    data = []
    for row in csv.reader(open(filename)):
        data.append(row)
    return data

def adjust_heading_degrees(alpha):
    '''add the heading angle to make it between -180 and 180 degrees'''
    return mod(alpha+180,360)-180

def normalize_vector(x,y,z):
    '''return a unit normal vector'''
    length = (x**2+y**2+z**2)**0.5
    return x/length, y/length, z/length

def calculate_geographic_offset(azimuth_angle,altitude_angle, distance):
    '''determine the displacement in terms of latitude, longitude, and altitude'''
    from math import sin, cos, tan, atan2

    R = 6371009  # radius of earth in meters
    dx,dy,dz = normalize_vector(
        sin(azimuth_angle),
        cos(azimuth_angle),
        tan(altitude_angle),
    )
    alpha = atan2(dy,dx)   # horizontal angle [radians]
    D_horiz = distance*(dx**2+dy**2)**0.5  # horizontal length [meters]
    delta_lat_rad = D_horiz*sin(alpha)/R  # latitude offset [radians]
    delta_lon_rad = D_horiz*cos(alpha)/(R*cos(radians(latitude))) # longitude offset [radians]
    delta_alt = distance*dz  # altitude offset [meters]
    return delta_lat_rad, delta_lon_rad, delta_alt


data=read_csv_file('places.csv') #name, long, lat

height = 2            # height of observer [meters] - whether we use height?
label_distance = 500  # distance along ephemeris vector [meters]
elevation = 2     # elevation above sea level [meters]

for row in data:
    longitude=float(row[2]) ## was reversed
    latitude=float(row[1])
    name=row[0]
    obs = ephem.Observer()
    obs.long, obs.lat = str(longitude), str(latitude)
    obs.elev = elevation + height
    sun = ephem.Sun()

    f=open("results/"+name, "w")

    for i in range(2021, 12021, 100): # 10,000 years of solstice sunrises - every 100 years
        d1 = ephem.next_solstice(str(i))
        obs.date=d1
        obs.horizon= '-0.34'

        sunrise=obs.previous_rising(sun) # this is in UTC
        obs.date=sunrise
        sun.compute(obs)

        delta_lat_rad, delta_lon_rad, delta_alt = calculate_geographic_offset(
            azimuth_angle=radians(adjust_heading_degrees(degrees(sun.az.real))),
            altitude_angle=sun.alt.real,
            distance=label_distance,
        )
        lon = longitude + degrees(delta_lon_rad)
        lat = latitude + degrees(delta_lat_rad)
        alt = height + delta_alt

        sunrise=ephem.Date(sunrise + 2 * ephem.hour)
        f.write(str(sunrise)+"|LINESTRING("+str(longitude)+" "+str(latitude)+","+str(lon)+" "+str(lat)+")"+"\n")
        f.close()
Links
https://rhodesmill.org/pyephem/quick.html
https://chrisramsay.co.uk/posts/2017/03/fun-with-the-sun-and-pyephem/
https://pythonhosted.org/pykml/examples/misc_examples.html
https://shallowsky.com/blog/science/astro/astronomical-alignments.html
http://astro.wsu.edu/worthey/astro/html/im-lab/stonehenge/stonehenge.html
https://en.wikipedia.org/wiki/Archaeoastronomy_and_Stonehenge
Further images
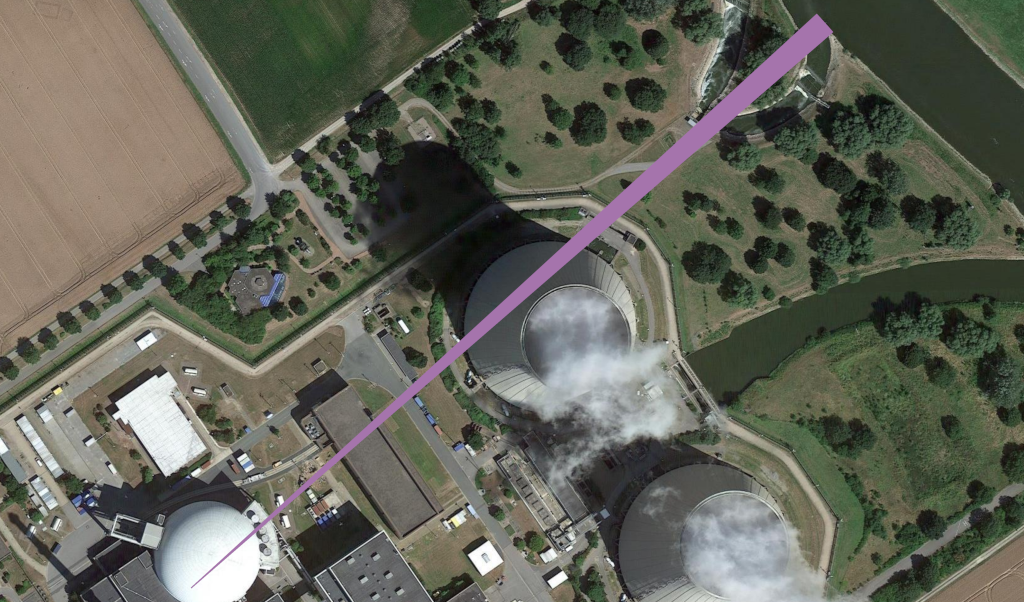
[2-KWG-GROHNDE: https://www.preussenelektra.de/de/unsere-kraftwerke/kraftwerkgrohnde.html]
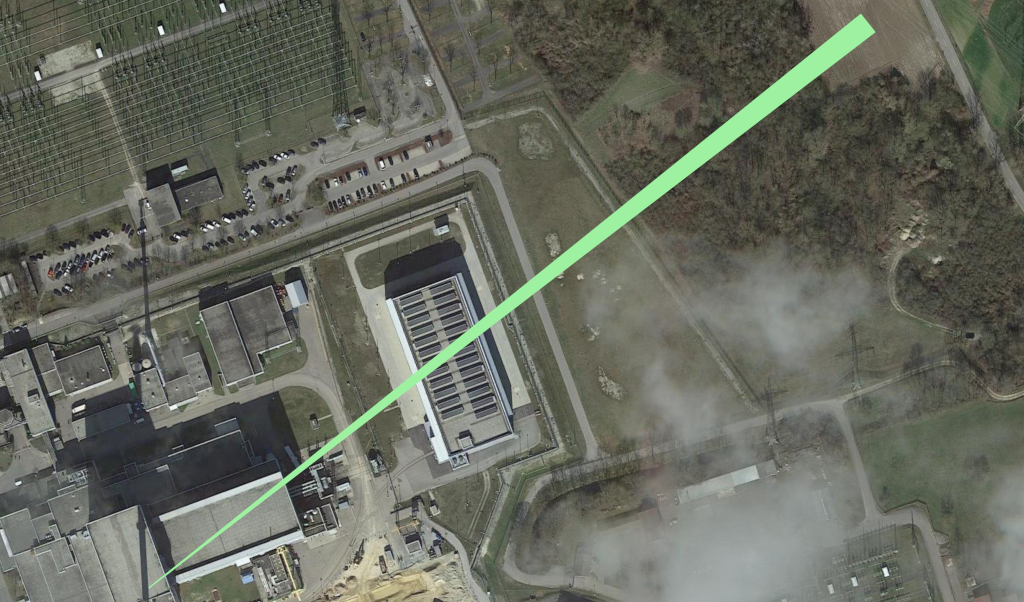
[3-KKII-UNIT1-ESSENBACH: https://www.euronuclear.org/glossary/kki-1/]
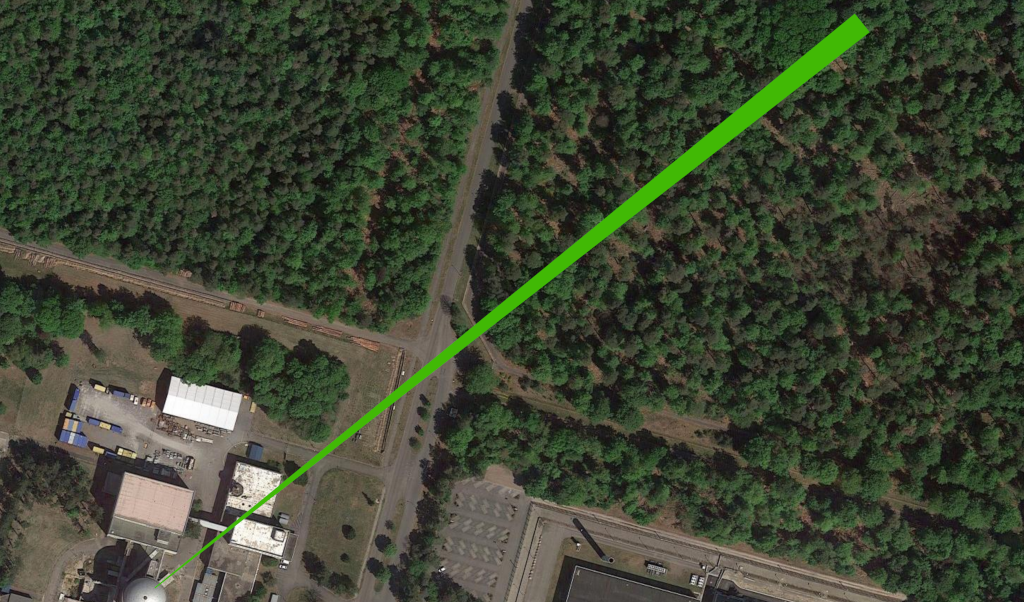
[4-MZFR-Leopoldshafen: https://www.atommuellreport.de/daten/detail/mzfr-karlsruhe.html]

[5-KKN-Niederaichbach: https://de.nucleopedia.org/wiki/Kernkraftwerk_Niederaichbach]